Financial data, Financial reports and Calendar
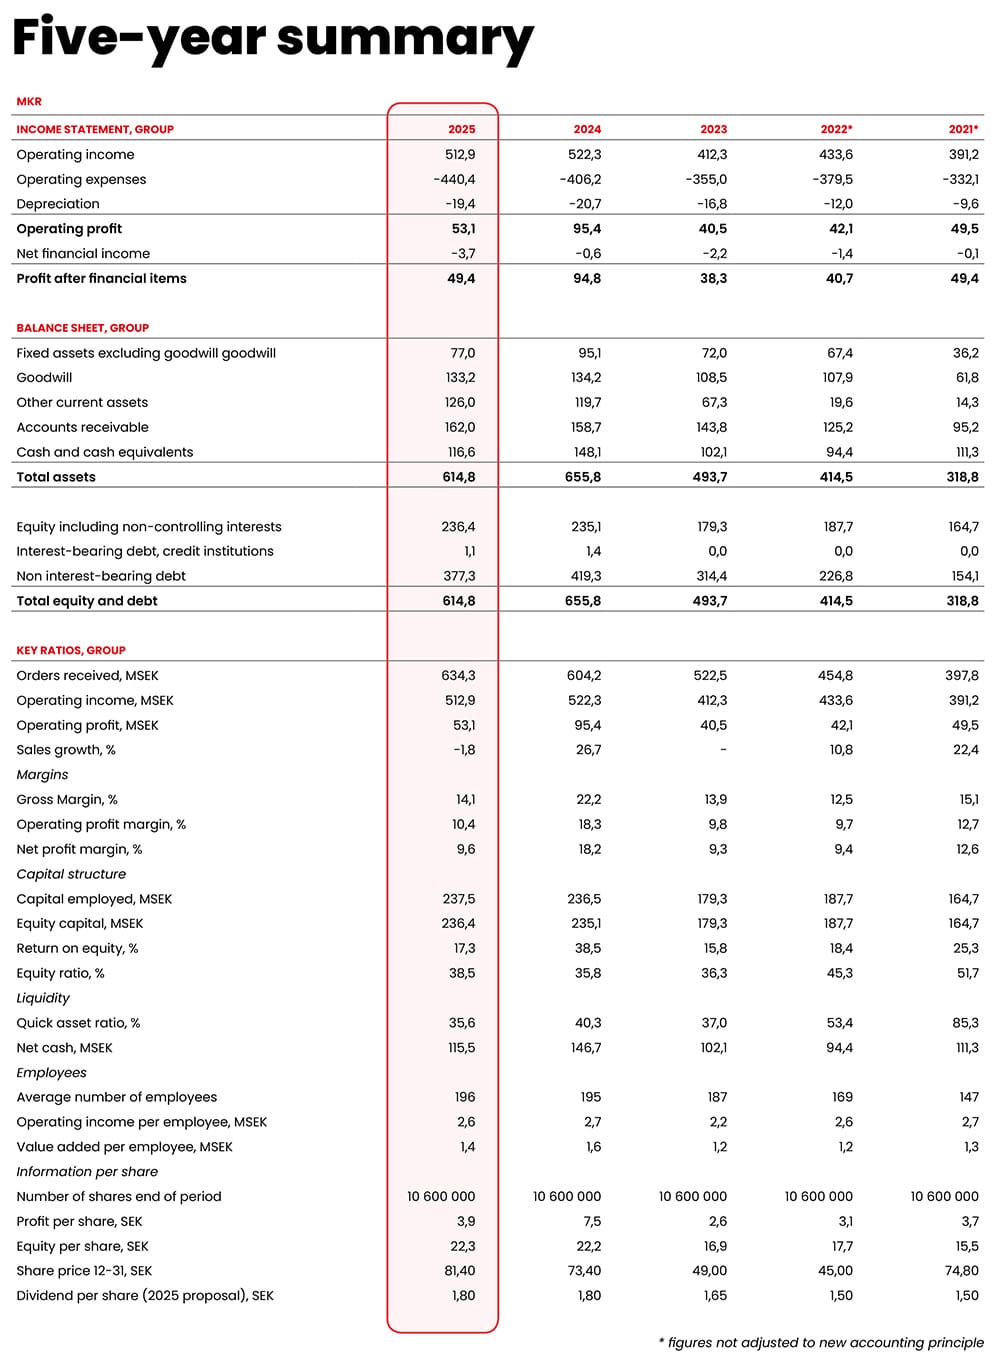
Financial data
Novotek’s goal is to achieve an average annual growth of 15 percent over time and an operating margin of approximately 10 percent.
Calendar
13/2/2026
Year-End Report
January – December 2025
5/5/2026
Interim report
January – March 2026
5/5/2026
Annual General Meeting
13/8/2026
Interim report
January – June 2026
10/11/2026
Interim report
January – September 2026
16/2/2027
Year-End Report
January – December 2026
Financial reports
(Only in Swedish)
Click on image to open a large version >>
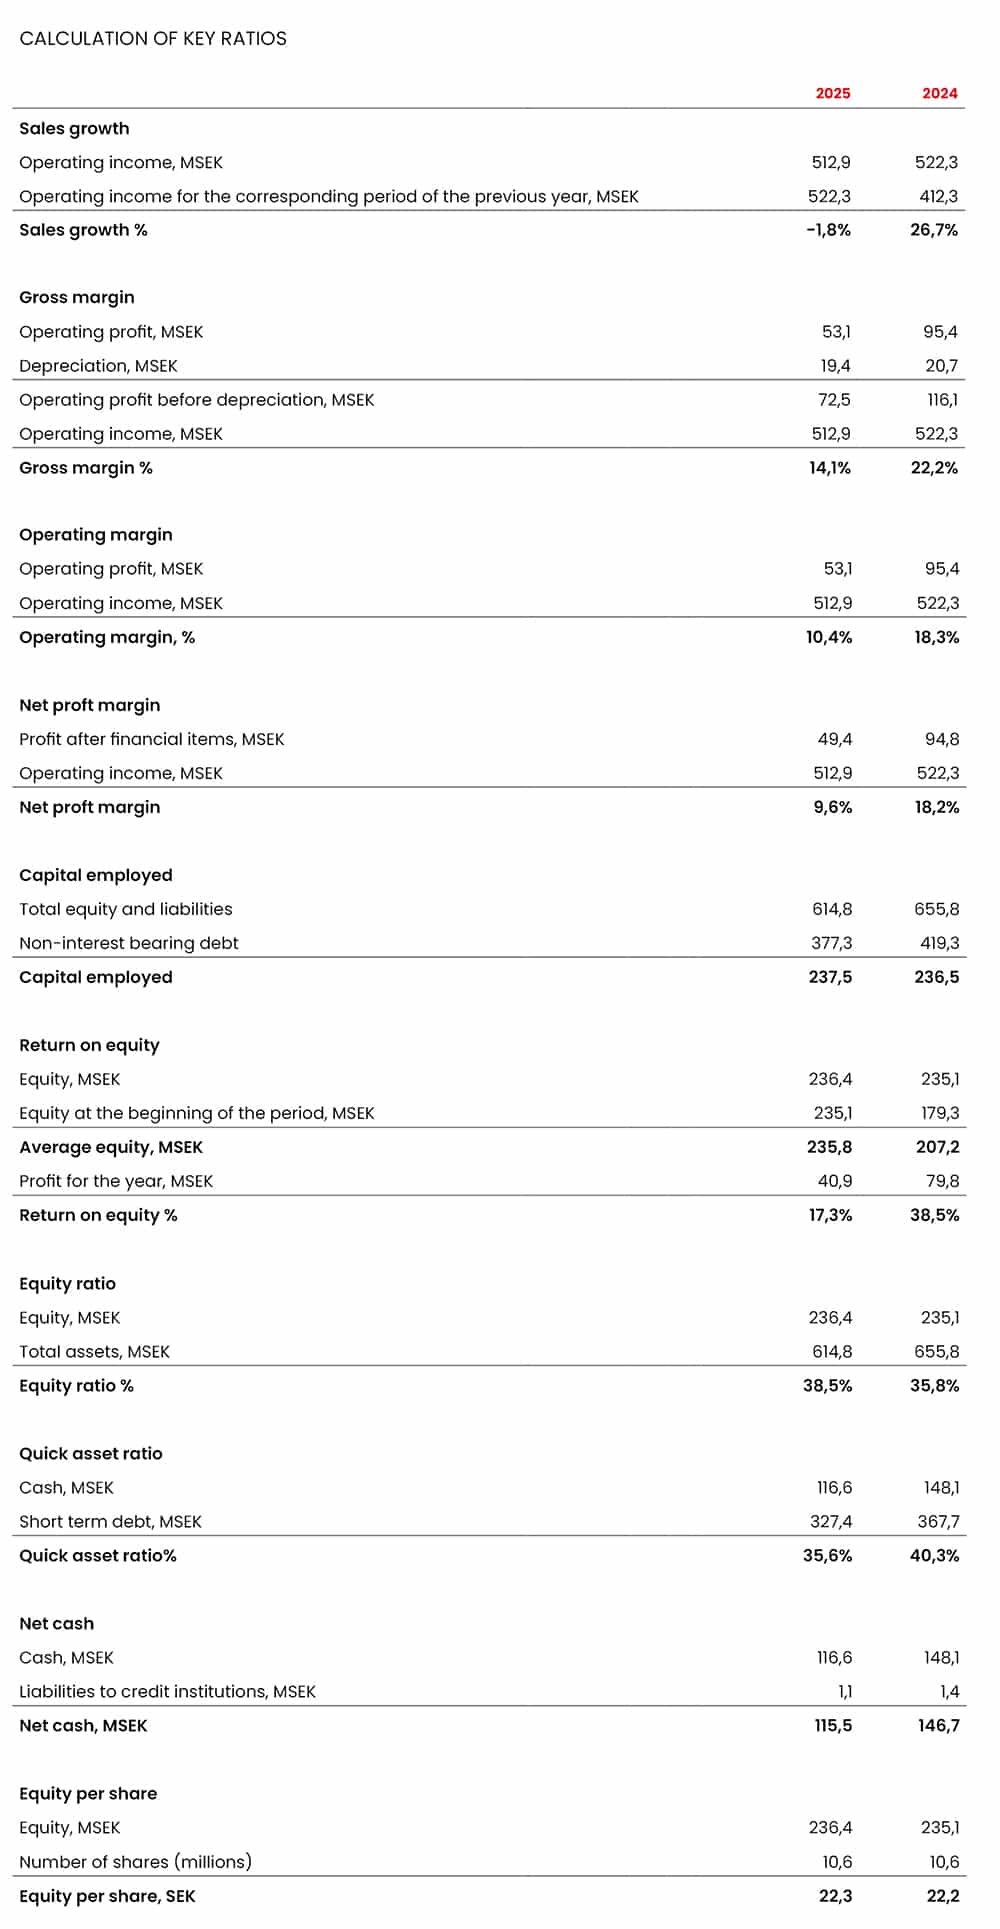
Key ratio definition
The table presents alternative performance measures, which complement the metrics that are either defined or specified in the applicable financial reporting standards under IFRS. Of the above key figures, only Earnings per Share is mandatory and defined according to IFRS. Novotek considers the other non-IFRS performance measures to be relevant for users of the financial reports, as a supplement for assessing and evaluating Novotek’s performance. Since not all companies calculate financial metrics in the same way, these measures are not always comparable with those of other companies. The definition, and in some relevant cases a description, of financial measures not defined by IFRS are provided below. The performance measures (Sales Growth, Gross Margin, Operating Margin, and Profit Margin) are key components in monitoring the Group’s value creation.
Sales growth
Change in total operating income. A key performance indicator used to assess whether the company’s growth targets are being achieved.
Gross margin
Operating profit before depreciation as a percentage of operating income. Relevant for assessing the company’s profitability level.
Operating profit margin
Operating profit as a percentage of operating income. Relevant for assessing the company’s profitability level.
Net profit margin
Income after financial items in percentage of operating income. Relevant for assessing the company’s profitability level.
Capital employed
Total assets less non-interest bearing liabilities. Capital employed is a measure of the total capital that the company borrows from its shareholders, who usually receive remuneration in the form of dividends, or that it borrows from credit institutions, who receive remuneration in the form of interest.
Return on equity
Profit for the year in relation to average shareholder’s equity. To assess the Company’s ability to reach an industry reasonable level of return on the combined capital of the owners made available.
Equity ratio
Shareholders’ equity at the end of the year in relation to total assets. Financial risk measure that shows the proportion of capital financed by the owners.
Quick asset ratio
Net cash as a percentage of short-term liabilities. A financial measure that shows short-term liquidity.
Net cash
Cash and cash equivalents minus interest-bearing liabilities to credit institutions. A financial measure that shows short-term liquidity.
Equity per share
Equity at the end of the period divided by the number of shares. A financial measure that assesses the company’s net worth per share and allows for an evaluation of whether the company is increasing shareholder wealth over time.
Profit per share
Income after tax compared with total number of shares.
Average number of employees
Average number of full year equivalent employees.
Value added per employee
Operating profit and employee cost compared with average number of employees.